Printable Coordinate Plane with Axis Labels (Free PDF)
You know exactly how frustrating it is to draw an X and Y axis entirely by hand with a plastic ruler. A printable coordinate plane with axis labels fixes this problem immediately. It gives you a pre-drawn Cartesian grid featuring clearly marked lines and perfect numbered increments.
I built this free online graph paper generator so you can instantly download and print these labeled planes. If you are a middle or high school student, you absolutely need these precise grids to plot coordinate points, graph linear equations, or solve complex geometric problems.
Using a pre-labeled grid saves you at least 15 minutes on every single math assignment. It completely prevents those messy, inaccurate hand-drawn lines. Your mathematical work stays 100% precise, and your teacher will have a much easier time grading your exams and giving you full marks.
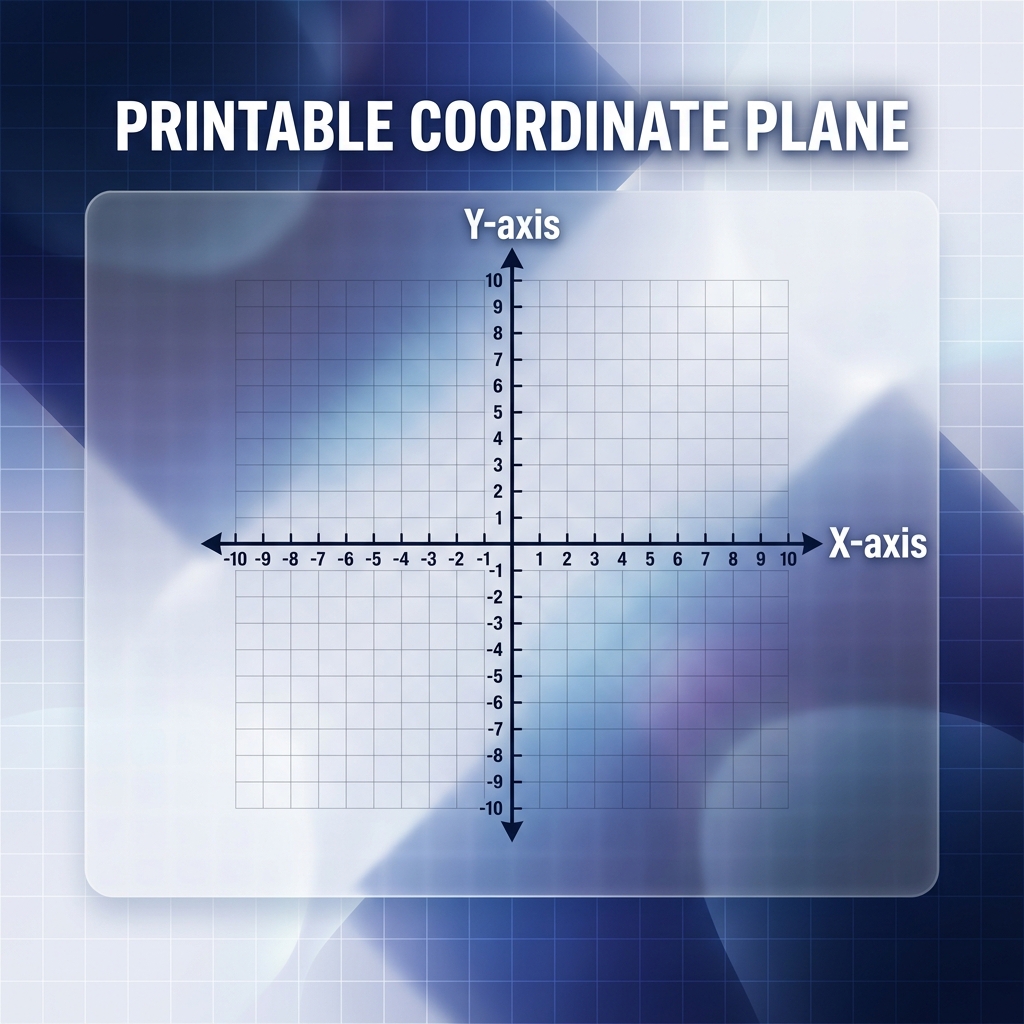
We know how annoying it is to draw an X and Y axis entirely by hand. You grab a plastic ruler, try to make the lines perfectly straight, and then spend five solid minutes writing tiny numbers on every single tick mark. It is a massive waste of classroom time.
That is exactly why you need a pre-made grid. Instead of drawing it yourself, you can just use our Custom Printable Graph Paper Generator to instantly print a perfect Cartesian plane. You get your paper in seconds, and you can jump straight into the actual math.
Table of Contents
- Why Labeled Axes Are Crucial for Algebra Students
- Understanding the Four Mathematical Quadrants
- Modern Teaching Methods for the Coordinate Plane
- Choosing the Right Grid Size for Your Assignment
- The Mathematical History of the Grid
- How to Generate Yours Right Now
- Frequently Asked Questions (FAQs)
- 1. What are the 4 distinct quadrants of a Cartesian coordinate plane?
- 2. How do you accurately plot points on a labeled coordinate plane?
- 3. Why is using a pre-labeled coordinate plane essential for algebra?
Why Labeled Axes Are Crucial for Algebra Students
When you are first learning algebra, visual accuracy is everything. If your axis numbers are spaced unevenly, your linear equation graph will look like a wavy curve instead of a straight line.
We have seen this silly mistake ruin test scores thousands of times. A pre-labeled grid removes human error. The lines are strictly uniform. The numbers are perfectly aligned. This guarantees that when a student plots the point (3, -4), it lands exactly where it should.
Teachers absolutely love these labeled PDFs because grading becomes effortless. You do not have to squint to figure out if a student plotted a point at 5 or 6. The numbers are already there.
Understanding the Four Mathematical Quadrants
A properly labeled Cartesian plane divides into 4 distinct quadrants. You must memorize these sections to graph efficiently.
I use a very simple trick to remember exactly how these 4 quadrants break down:
- Quadrant I: Top right section. Both X and Y values are positive. Example: (2, 5).
- Quadrant II: Top left section. X is negative, but Y is positive. Example: (-4, 3).
- Quadrant III: Bottom left section. Both X and Y values are negative. Example: (-6, -2).
- Quadrant IV: Bottom right section. X is positive, but Y is negative. Example: (7, -1).
If you forget these rules, a labeled plane is your best friend. The negative numbers are printed right on the left and bottom axes, acting as a constant cheat sheet.
Modern Teaching Methods for the Coordinate Plane
Education has changed drastically. Today, teachers use active learning and digital integration. However, we want to tell you that the physical printed grid remains irreplaceable for building muscle memory.
Digital tools like Desmos are incredible for dynamic graphing. You can move sliders and watch a parabola shift instantly. But research shows that you need tactile, hands-on practice before you fully grasp the abstract concepts.
Teachers use the "crawl before you climb" method. They print our labeled planes, place them on desks, and have you physically move your pencil along the X-axis (crawling) before moving up the Y-axis (climbing). This physical movement locks the concept right into your brain!
Choosing the Right Grid Size for Your Assignment
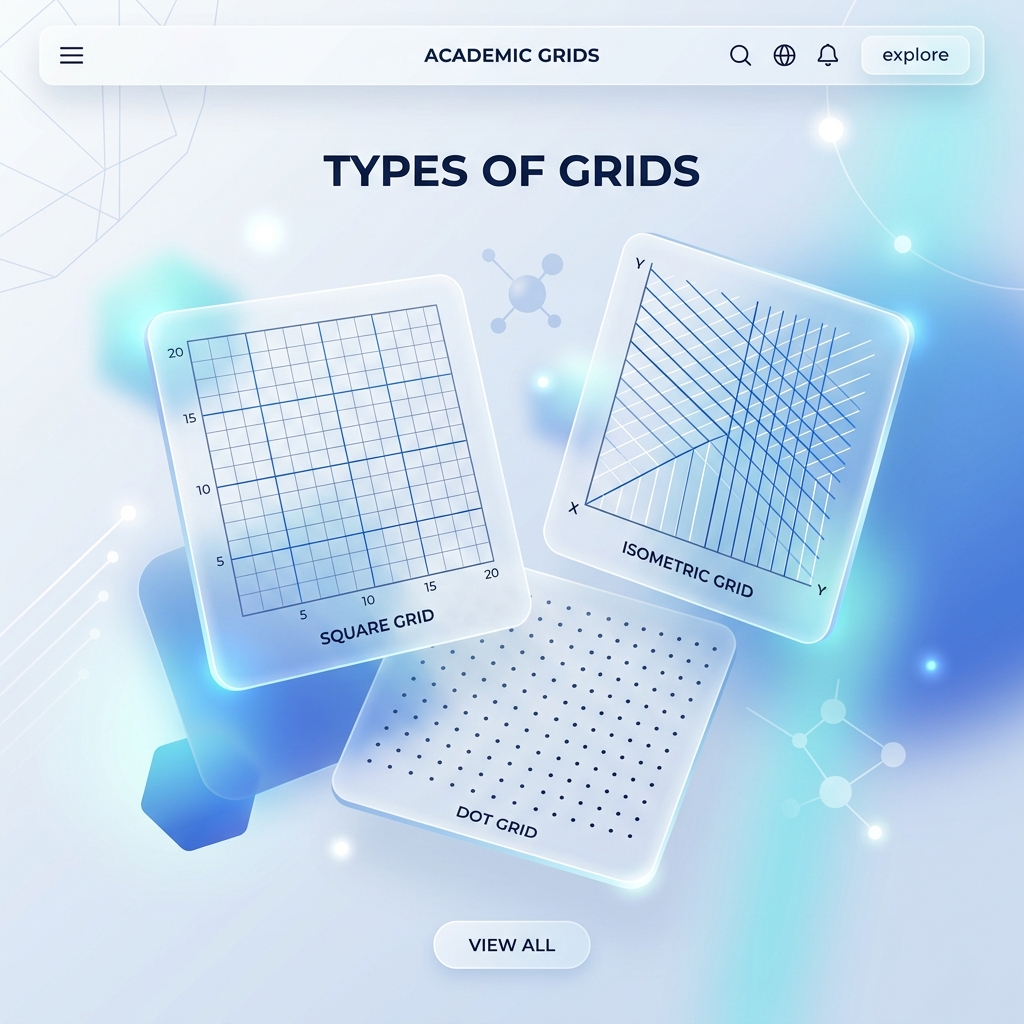
Not all math problems require the exact same type of grid. Depending on what you are plotting, you need the right scale. Use this quick guide to choose.
| Grid Spacing | Best Use Case | Ideal Grade Level |
|---|---|---|
| 1 Centimeter | Basic point plotting, large shapes | Primary / Middle School |
| 1/4 Inch | Graphing linear equations, standard algebra | High School |
| 5 Millimeter | Calculus, engineering, precise data plotting | College / University |
If you are a teacher looking to print a set of worksheets for your class, we highly recommend using the 1/4 inch spacing. It gives students enough room to write their coordinates clearly without taking up the entire page.
The Mathematical History of the Grid
Before you print your paper, it is fun to know where this system came from. The Cartesian coordinate system was invented by the French mathematician René Descartes in the 17th century.
Legend says he was lying in bed, watching a fly crawl across the ceiling. He realized he could describe the exact position of the fly by measuring its distance from the two adjacent walls. That brilliant moment of laziness gave birth to the X and Y axes we use today.
How to Generate Yours Right Now
Stop wasting precious time drawing grids by hand. Head over to our Graph Paper Generator right now.
Select your paper size. We offer A4 standard size (perfect for India and the UK) and US Letter size. Choose Cartesian squares, pick your line color, and hit download. You will have a perfect, high-resolution PDF saved to your computer in seconds.
Frequently Asked Questions (FAQs)
1. What are the 4 distinct quadrants of a Cartesian coordinate plane?
The 4 mathematical quadrants graph paper divides space into four sections. Quadrant I is top-right (positive X/Y). Quadrant II is top-left (negative X, positive Y). Quadrant III is bottom-left (negative X/Y). Quadrant IV is bottom-right (positive X, negative Y).
2. How do you accurately plot points on a labeled coordinate plane?
You always start at the origin point (0,0). You move along the horizontal X-axis first, going right for positive or left for negative numbers. Then you move along the vertical Y-axis, going up for positive or down for negative numbers.
3. Why is using a pre-labeled coordinate plane essential for algebra?
Using a printable coordinate plane with axis labels prevents human error. It guarantees that your number spacing remains mathematically perfect. This ensures your graphing linear equations grid results in perfectly straight lines rather than sloppy curves.

💬 Discussion
0 Comments