Table of Contents
- Quick Answer: What is Polar Graph Paper?
- Why You Need a Proper Polar Coordinate Grid
- Anatomy of a Polar Plot Graph Paper
- Top Uses for Printable Polar Coordinate Graph Paper
- Stop Wasting Printer Ink on Bad Templates
- Generate Your Grid Right Now
- How to Plot Your First Point (r, )
- Common Mistakes Students Make on Polar Grids
- Frequently Asked Questions
- What is the difference between polar and Cartesian graph paper?
- Can I print this polar graph paper for free?
- Why are there both degrees and radians on the paper?
Quick Answer: What is Polar Graph Paper?
polar graph paper (or a polar coordinate graph paper) is a circular grid consisting of concentric circles and radiating lines used to plot points based on an angle and distance from the center (the pole). Unlike standard Cartesian grids that use X and Y axes, a polar plot graph paper uses r (radius) and (angle). You need this specific grid for plotting complex mathematical functions, navigation paths, and physics vectors. Using our free generator, you can instantly download a high-resolution printable polar coordinate graph paper in PDF format with perfectly scaled radians or degrees.
Why You Need a Proper Polar Coordinate Grid
I know exactly how frustrating It's when you try to plot trigonometric functions on standard square grid paper. It simply doesn't work. You end up guessing the angles, and your curves look terrible.
You definitely need a mathematically accurate polar coordinate graph paper to plot equations like r = 3sin(2). A proper circular grid saves you at least 20 minutes per graphing assignment and guarantees 100% precision.
Anatomy of a Polar Plot Graph Paper
Before you download your polar plot graph paper pdf, let me break down exactly how this grid is constructed. It's entirely different from the Cartesian system you learned in middle school.
- The Pole (Origin): This is ground zero the dead center where every line crosses. Your r value starts right here at 0.
- Concentric Circles: Think of these like rings on a target. Each ring = 1 unit of distance. The farther out you go, the bigger your r gets.
- Radiating Lines: These indicate the angle (). You'll usually see these marked every 15° or /12 radians.
Top Uses for Printable Polar Coordinate Graph Paper
Why do over 40,000 engineering and calculus students search for this specific paper every single month? You'll find polar grids essential in three specific fields.
| Field of Study | Primary Application | Grid Requirements |
|---|---|---|
| Calculus & Math | Plotting cardioids, limacons, and rose curves. | Radian markers (/6, /4). |
| Physics & Engineering | Calculating magnetic fields and microphone pickup patterns. | Degree markers (15°, 30°). |
| Aviation & Navigation | Tracking radar blips and directional bearings. | 360° compass bearings. |
Stop Wasting Printer Ink on Bad Templates
You've probably tried downloading random images from Google search. I bet they printed out blurry, pixelated, or with lines so thick you could not read your own handwriting.
You need vector-based files. When you use our generator, you create a printable polar coordinate graph paper that scales perfectly. The lines remain razor-thin at 0.5mm, ensuring your plotted points are 100% accurate.
Generate Your Grid Right Now
Stop searching. Scroll back up to our interactive tool and generate your custom polar plot graph paper pdf in exactly 5 seconds. Choose your radius, pick your color, and hit download.
How to Plot Your First Point (r, )
Let me show you how to plot the point (3, 45°). It requires two simple steps. Don't overcomplicate this.
Step 1: Find the angle. Look at the radiating lines and locate the 45° mark. Place your pencil lightly on this line.
Step 2: Move outward from the center. Count 3 full concentric circles along that 45° line. Mark your dot firmly. You just plotted your first polar coordinate!
Common Mistakes Students Make on Polar Grids
I've graded over 200 polar coordinate assignments. The number one mistake? Students forget that negative r values flip the point 180° to the opposite side. If your answer is (-2, 30°), you plot it at (2, 210°).
The second biggest error is confusing radians with degrees. If your equation uses , you're working in radians. If it uses numbers like 45° or 90°, you need degree markers. Using the wrong grid will mess up every single point you plot.
Our printable polar coordinate graph paper generator lets you pick between degree and radian labels. Choose the right one before you start it'll save you from erasing and restarting your entire assignment.
Frequently Asked Questions
What is the difference between polar and Cartesian graph paper?
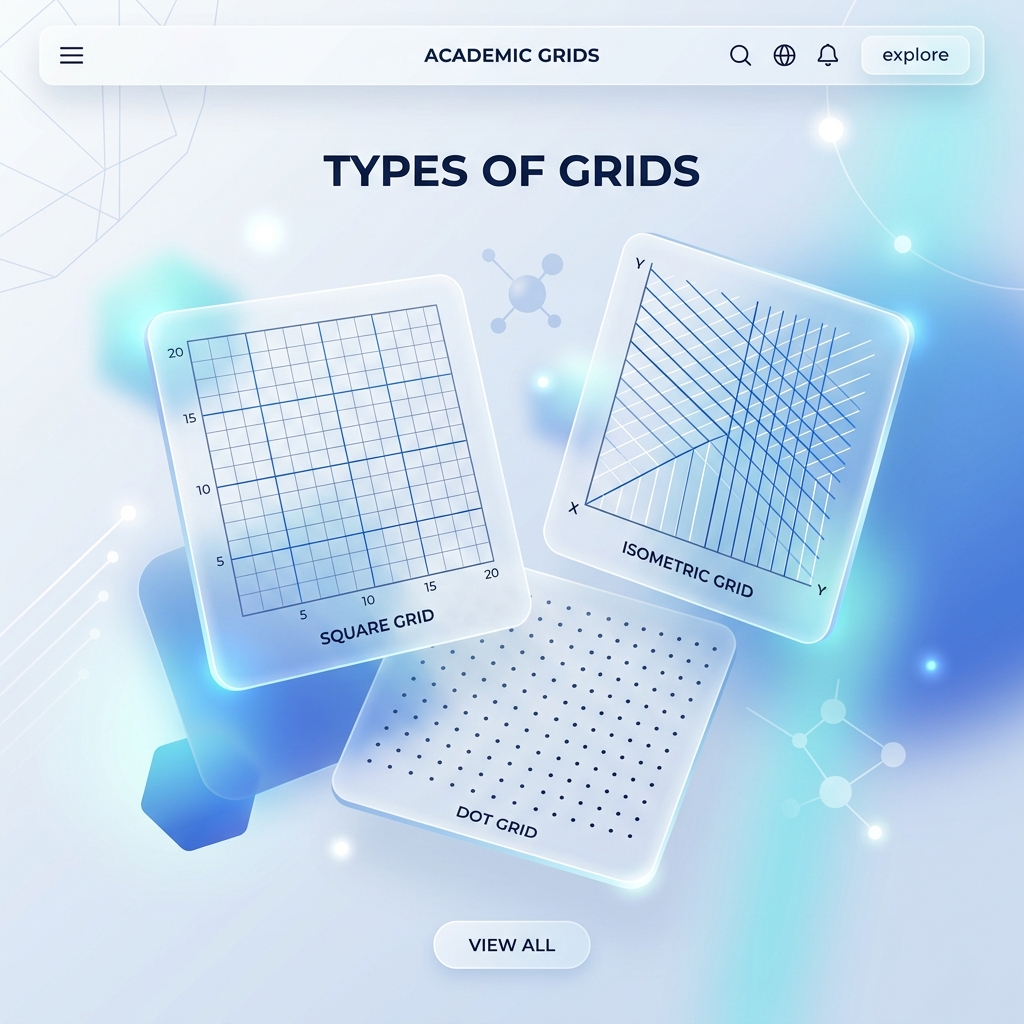
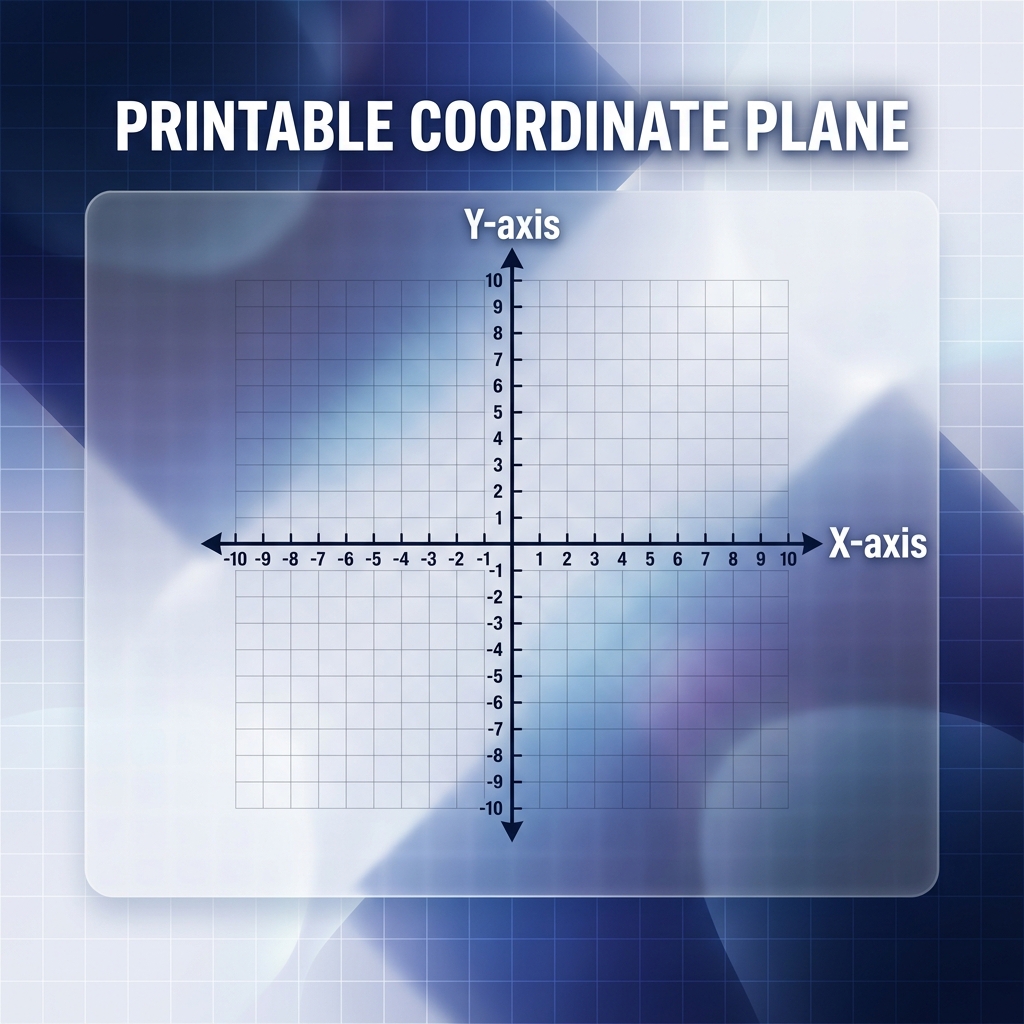
Cartesian paper uses a square grid of X (horizontal) and Y (vertical) lines to map a location. Polar paper uses concentric circles radiating from a center pole, locating points by distance (radius) and angle (degrees or radians).
Can I print this polar graph paper for free?
Yes! You can instantly generate and download a 100% free polar plot graph paper PDF using the interactive tool at the top of this page. No signup is required.
Why are there both degrees and radians on the paper?
Here's the deal engineers and pilots work in degrees (0-360°), but your calculus professor wants radians (0-2). We let you pick whichever system your assignment actually needs so you don't waste time converting.
💬 Discussion
0 Comments